It's been a while since I posted. Mainly because I took a two week trip back to America and totally forgot to copy over IDA. Now that I'm back and my jetlag has subsided a bit, I'd like to post a real quick update on how to get IDA to load that 'hidden' data from PnkBstrK.sys. While the '.reloc' section wasn't marked in the PE, the hidden data, according to IDA is simply the .reloc section. Apparently, to get it to load you need to do a Manual Load when you first do your analysis. If someone knows how to get IDA to re-analyze the file and not lose your comments/symbols that you've added I'm all ears.
Since I couldn't figure out how to do that, I decided to just reload the file and manually add in my comments again. When you first load a new file you have a number of options to chose from.
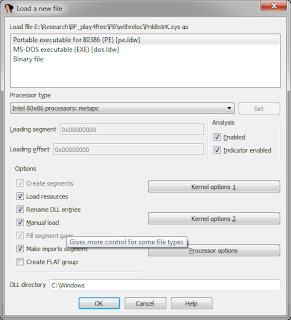 |
| Make sure to select 'Load resources' and 'Manual Load' |
After selecting the Manual load and Load resources check boxes go ahead and click OK. You'll then be asked if you want to specify a new base image (rebase). Since my VM image is locked with the driver loading at EE118000, I decided to set the base image to that so I don't have to do any math when I'm comparing addresses.
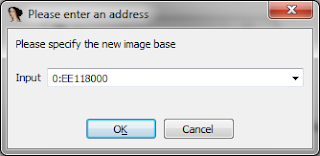 |
| Setting a base address to my VM image's driver location. |
Finally, the part we really need, is to have IDA ask us which segments we want to add for analysis. You'll notice here that the last one is what we need, the '.reloc' section. Why this isn't done by default I'm not exactly sure, but after loading this you'll be able to see all that extra hidden code that PnkBstrK.sys has. This will make our analysis much easier in the end.
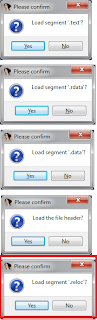 |
| IDA asking us which segments to load. |
As you can see in the final image, our new IDA window on the left shows the jmp address as going to a valid location.
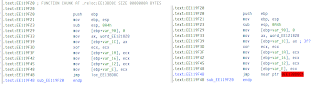 |
| Left: Valid analysis with .reloc address, Right: Old version jumping to unknown address |
That's pretty much it, now I can properly trace all the calls to the code outside of the .text/.data sections that PnkBstrK does.


