Tuesday, June 26, 2012

Dumping PnkBstrK.sys

So I finally had a few hours to sit down and muck around in driver land tonight. I learned a few useful things about WinDBG which I kind of which I had known before. This reminds me I should probably read WinDBG A-to-Z from back to front (or front to back, sheash I've been in Japan too long) at some point.

Once again I started from the beginning and traced through the first IOCTL coming in. I tried to look for any sort of patterns but again my boredum got the best of me and I kind of gave up. One thing I know is that it is occuring in some sort of loop. I set a break point on the below address because it jumped back to this point a number of times in the code.
.reloc:EE05BB4E                 lodsb

For those who aren't aware, lodsb basically will take a byte out of ds:esi and store it in al (because we're doing a Load Store Byte). It then increments or decrements esi depending on the df (Direction Flag). By looking at the following code, sure enough eax appears to be a register of importance. One thing I realized I *should* have done, and probably will do once I get some more free time is to totally disregard all the stupid register operations that are going on in this loop and concentrate on one important factor.

When do the values of registers get *written* to locations in memory? This is a very important operation because this is what will give away what it is doing. I need to see if it's writing to the driver itself? (self modification) or writing to some objects in memory, or doing something else crazy. So this is really where I should have concentrated my efforts better. Instead I was 'getting a feel for it' also known as 'not having a fucking clue what I'm doing'.

So I set a breakpoint at the lodsb operation in the .reloc section to print out what exactly esi was pointing to. After a few bagillion operations I got a nice table of what byte it was pulling from esi and storing in al.
The command I ran was:
bp ee05e11d ".printf \"esi: %08x ds:esi: %08x\r\n\",esi,by(@esi); g"

This basically sets a break point and tells it to call the printf function displaying both what esi is, and the low-order byte that esi points to (note the 'by()' function). Then it tells it to continue running. So I got this enormous table which, is pretty friggen useless to me. While I'm sure if I had time I could script something up to recreate exactly what it is doing, I still hadn't looked at what it's doing with the value once it got into the al register.


So even though I am pretty tired of looking at this loop I will need to go back to it and look for any when registers are dereferenced or direct memory locations are referenced for mov or write operations. So I can see what it's modifying. This shouldn't be too hard I think, because from what I could tell it wasn't modifying the loop itself, just other parts of the driver.


So to do something a bit different I decided that maybe I should just dump the driver's memory while it's running during various IOCTLs and see if I can see any major changes. After a bit of searching I found out you can dump arbitrary memory by using the .writemem command. This takes addresses/ranges and will spit out the resultant bytes to a file. In my case I ran:
.writemem c:\temp\pnkbstrk_dump_ioctl1.sys 0xEE050000 0xEE073FF6 a few times with varying filename parameter values. The 0xee05000 is of course the base address and 0xee073ff6 is the end of the file.
i'm in ur memory, dumpin' ur codes.
So now I have three new driver files to look at. Oddly enough they look very different from the one from on disk and I'm not entirely sure why, but there's enough similarity in them to lead me to believe it's just what is in memory, so whatever. For example when the first IOCTL is called the DriverEntry function looks waaaaaaaaaay different then the one I'm working with in IDA (pulled from disk). Even though, I think, none of the self modification code has been called yet? If someone could explain how the hell this happened I'd appreciate it :>.

Anyways, the most striking difference I found is the relocation table/fix up code that I RE'd a while back. You may remember it was a series of 1000xxxx values that get rewritten to include the real address. Anyways here's what they look like side by side after the first IOCTL has been called.
yehp, symbol names.
The other thing I noticed was another area around this section of the driver that contained a very curious ID. So curious that I think it might be my GUID, the one that EvenBalance/PunkBuster use to global shit ban people. This is the first time I've seen it so I'm totally jumping to conclusions on that. Anyways, since that *may* give away who the hell I am, i'mma muck with it in the image below:
My guid? Maybe? Notice the BFP4F in the middle of it...
It's a 69 byte long string with BFP4F in the middle of it. The first section (before the BFP4F string) is 24 bytes, the second section (after the BFP4F) is 40 bytes. Both sections are stringified hex strings, as in a string representation of the hex bytes. So yeah, maybe two 32 byte md5 hashes with a BFP4F thrown in the middle to split them up? I dunno... yet!


Thursday, June 7, 2012

Tedious Boring Work (Obfuscation 1, Me 0)

I really do want to be posting more, and exploring more and learning more. But right now I'm stuck in state of tedium. The past few attempts at looking at PnkBstrK.sys have left me pretty bored. Right now the majority of the code is doing some sort of silly obfuscation and is just fixing up addresses and data. After the first IOCTL is sent to the driver, the IOCTL instructs the driver to fix up some table of addresses. In IDA we can see this table of pointers in it's base address form.
A table of pointers that are to be 'rebased' during execution
 You can see from my comments in the above code that various registers contain the address of the driver in memory, which in a below function are used to recalculate the table and update it to point to where the driver is loaded for the current execution run. This table, when all is said it is updated to look like:


ee05b844 ee05e046
ee05b848 ee05c997
ee05b84c ee05d719
ee05b850 ee05bc4d
ee05b854 ee05f5f1
...
ee05bad0 ee05c842
ee05bad4 ee05c049
ee05bad8 ee05f3e4
ee05badc ee05eff3
ee05bae0 ee05cc3c

While that part of the code is easy to understand, what isn't easy is the next part.
Borrrrrrrrrrrrrrrrrrringgg....
The rest appears to just be doing arithmetic to change various addresses both in the stack and in the registers. It's so boring and tedious that I find it hard to walk through more than a few functions at a time before I give up and go do something else.

I guess, that *would* be the entire point of obfuscation :>. However, I don't plan on giving up, but forgive me this might take a bit longer because, well, it's boring as shit. Someday when I have more free time (right now i'm clocking in about 1-2 hours a week looking at this) I'll sit down and run through the entire process to see if there are any patterns I can extract on what it is doing from a more high level view point.


Friday, May 25, 2012

Manually Loading Segments in IDA

It's been a while since I posted. Mainly because I took a two week trip back to America and totally forgot to copy over IDA. Now that I'm back and my jetlag has subsided a bit, I'd like to post a real quick update on how to get IDA to load that 'hidden' data from PnkBstrK.sys. While the '.reloc' section wasn't marked in the PE, the hidden data, according to IDA is simply the .reloc section. Apparently, to get it to load you need to do a Manual Load when you first do your analysis. If someone knows how to get IDA to re-analyze the file and not lose your comments/symbols that you've added I'm all ears.

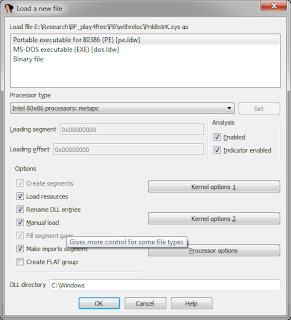
Since I couldn't figure out how to do that, I decided to just reload the file and manually add in my comments again. When you first load a new file you have a number of options to chose from.
Make sure to select 'Load resources' and 'Manual Load'
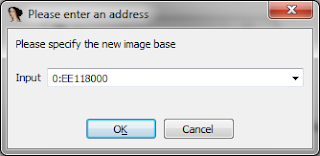
After selecting the Manual load and Load resources check boxes go ahead and click OK. You'll then be asked if you want to specify a new base image (rebase). Since my VM image is locked with the driver loading at EE118000, I decided to set the base image to that so I don't have to do any math when I'm comparing addresses.
Setting a base address to my VM image's driver location.
Finally, the part we really need, is to have IDA ask us which segments we want to add for analysis. You'll notice here that the last one is what we need, the '.reloc' section. Why this isn't done by default I'm not exactly sure, but after loading this you'll be able to see all that extra hidden code that PnkBstrK.sys has. This will make our analysis much easier in the end. 
IDA asking us which segments to load.
As you can see in the final image, our new IDA window on the left shows the jmp address as going to a valid location.

Left: Valid analysis with .reloc address, Right: Old version jumping to unknown address
That's pretty much it, now I can properly trace all the calls to the code outside of the .text/.data sections that PnkBstrK does.

Monday, April 23, 2012

Sneaky Sneaky... PnkBstrK.sys's hidden code.

As you might recall from my last post I'm now in the process of determining what the IOCTLs do. There was however one thing that was really bugging me. I didn't allude to this yet because I figured I was doing something stupid and just didn't understand how the driver's code was being mapped into memory by Windows. It turns out PnkBstrK.sys is doing something a little bit sneaky. Before I get into showing what they are doing,  I want to describe the problem.

When attempting to determine what the IOCTLs are actually doing I was noticing the first IOCTL that was "attempted" was calling a function which after doing some oddness, was jumping into some memory location that wasn't showing up in IDA. The first IOCTL that is seen by our DeviceControlDispatchHandler function is 0x2261c0.
First function that is called from the 0x2261c0 IOCTL.
 This function clears out some addresses and moves the value 0x3f onto the stack. Then jumps into some unknown address.
A jmp into an unknown memory address.
This is where I was stuck. I had no idea where this memory location was coming from. So I figured they were jumping into a non .text section. If you aren't familiar with the various sections of a PE file I suggest reading the PECOFF document from Microsoft. So in IDA you can look at the various segments by hitting "Shift+F7" or View->Open Subview->Segments. Here's basically what I saw:
PnkBstrK.sys segments
You'll notice none of those addresses are within range of our 'unknown' jmp address. Ok so now what? I honestly had no idea. When debugging the driver and that ioctl is called, it jmps to the unknown address but magically a valid code block is there. But how? I can't see any of the data in the segments and I certainly can't see any data in the .text segment. I called shenanigans.

I totally reset my vmware image thinking that some how during installation it was doing something to create this page in memory without me catching it in time. My first suspicion was that code was being called before the DriverEntry method. I searched all over Microsoft documentation to see if there was any other way of calling a driver besides the DriverEntry function. While I found out there is, it's only if you rename the DriverEntry function to something else (which this driver is not doing).

So I decided to look at something else. I loaded up PEiD which is a tool for looking at the segments. My thought process here was that they were doing something to trick IDA Pro. Here's what PEiD reports:
PEiD section output
OK so, basically the same thing. So I went back to WinDBG to see if there were any other hints. You may remember from a long time ago, one of the methods I use in RE'ing (because I suck at it) is to use surrounding data as possible hints to what the code is doing. In this case I am looking at surrounding data to find hints as to where the code came from. So here's what I see at that address in the data output (instead of looking at the disassembly) of our "unknown" address:
The data at our unknown address. Note the VeriSign certificate information
OK so that is a pretty good hint. So going back to IDA I searched for the string VeriSign (alt+T to search for text) and guess what. Absolutely nothing. So I had one last thought. Maybe it's not really contained in a valid segment at all, maybe it's contained in the binary and they're doing a hardcoded jmp? So I want to look at the PECOFF structure. For that I use 010Editor with the PECOFF template. I load the file, open the template and run the template against PnkBstrK.sys. I notice the following bits of data:
Overlay? What the hell is that?
So there's this 'overlay' section, and the data?
There you are! You sneaky bastard!
So in the EXE template I looked at how 'overlay' data is generated and I found they simply check:


if(max < FileSize()) {
   BYTE Overlay[FileSize()-max];
}

That is all they are doing. PnkBstrK.sys isn't creating a section for it, they're just appending the data which will still get mapped into memory and then they are 'hardcoding' the jmp to the offset into this extra data area. Pretty sneaky.

It is almost like a magic trick, at first it seems like magic, then you realize you're just an idiot for not knowing how it worked to begin with.

NOW I can start to figure out what these IOCTLs do :>

Tuesday, April 17, 2012

Kernel Hacking Is Hard (KHIH)

Besides totally slacking on game hacking, I have taken the time to read four documents from Microsoft which I felt were important for gaining at least a bit of understanding of this driver craziness.
1. Architecture of the Kernel-Mode Driver Framework
2. Architecture of the Windows Driver Foundation
3. I/O Flow and Dispatching in WDF Drivers
4. Handling IRPs: What Every Driver Writer Needs to Know

Since I have a little (and I mean very little) understanding of drivers, I do have a bit of a suspicion that the PnkBstrK.sys driver is simply reading in custom IOCTLs and acting upon them. However, I wanted to confirm this. I did a bit of reverse engineering of the PnkBstrK.sys DriverEntry function. You'll notice in my IDA output I renamed a lot of things (and added comments) to make understanding what was going on a bit easier. Remember ';' for adding comments and right click -> rename for renaming labels/functions whatever.
PnkBstrK.sys DriverEntry function.
It's a pretty standard setup, loop over and set all IRP handlers to the same function. Except one, you'll notice at .text:10033FB (I renamed DeviceControlDispatchHandler) a function is moved into an offset into the DriverObject structure.  Initially when analyzing this, I missed that line and during debugging sessions always ended up going to the same stub dispatch function which did nothing. So what is this special handler? This is actually the dispatch handler that will handle the IRP_MJ_DEVICE_CONTROL "event" or whatever the hell they're called in kernel land. All of the other handlers don't do anything but accept the IRP and pass it on/finish it.

Later on, you'll notice a call to IoCreateDevice with the "\\device\pnkbstrk" as the device name. Further down in the code a symbolic name "\\DosDevices\\pnkbstrk_link" is also created which the user-mode applications will most likely call. However, I have yet to verify this.

Which is actually my biggest problem, trying to figure out how user-mode code calls into this driver. After searching around I found a really good forum post on how to gain a bit of additional information when debugging drivers. From that post I learned if you are actively debugging PnkBstrK.sys there's a way you can determine what IRP handlers are mapped to. In WinDBG you run "!drvobj PnkBstrK 7" which gives the following output:
PnkBstrK.sys IRP dispatch handlers
You'll notice they're all set to the same address, except one: [0e] IRP_MJ_DEVICE_CONTROL. This is what I believe the user-mode code calls to interact with this driver. So my next step(s) are to do a bit of analysis of this device control handler function. For that I turn back to IDA.

Here's what the device control handler function looks like by itself:
device control handler function with no comments/names.
So that's not really helpful. Again, taken from that above post he suggests including the IRP and IO_STACK_LOCATION structures into the IDA session. This ends up helping a lot. How do you add structures? It's pretty easy, click on the 'structures' tab of your IDA view and hit the 'Insert' key. Next click 'Add standard structure'. Then find the IRP structure (or _IRP).
Adding the IRP structure to IDA
Do the same for the IO_STACK_LOCATION structure and go back to the device control dispatch function at .text:10002fC0. Now we can change Irp+60h to [eax+IRP.Tail.Overlay.anonymous_1.anonymous_0] by selecting the 60h part and hitting 'T' and selecting the proper value. Not sure why it's that structure value, but whatever, that's what the dude from the forum said. Three lines below that you'll see a mov eax, [edx+0Ch]. This can be transformed to: IO_STACK_LOCATION.Parameters.DeviceIoControl.IoControlCode which looks a bit more reasonable to me. Here's what I've come up with for this segment of code after doing some initial analysis of it:
DeviceControlDispatchHandler with comments.
Of course, I've just started doing this reverse engineering so there are two things to keep in mind; I'm not done yet and I could totally be wrong. Trying to figure out what the Irp+60h value pointed to turned out to be challenging for me. I looked through the 'wdm.h' header file and found the _IRP definition but without looking up all it's members, I have no idea what the 0x60h offset points to. Again, the forum post I mention earlier helps clear that up, but I hadn't read it at that point. If you haven't already, I seriously suggest going back to read it.

*After* reading that post, I tried running the commands he mentioned to see what the structures look like from WinDBG, but it went horribly wrong. Mainly because I wasn't referencing the value correctly.
Attempting to display the IRP struct values using the wrong value.
Next I waited until ECX got set to the value of the IRP structure and tried again:
_IRP.Tail (0x40) + CurrentStackLocation (0x20) => 0x60 = IO_STACK_LOCATION (I think?)
So this looks 'better' but the 'memory read errors' throughout the structure references makes me think I might be wrong. OH WELL. I'm sure it'll all become clear the more I work with this stuff.

Of course, next up is reversing what the different IOCTLs actually do. That might take me some time, but I'll keep at it, don't you worry.

Wednesday, April 4, 2012

Punking PnkBstrK.sys

Man talk about being out of ones league! So I've been spending the last few days trying to brush up on how to reverse Windows Kernel drivers. First step was flipping through pages of Rootkits: Subverting the Windows Kernel to learn the basics of how kernel drivers work. I really have never looked this deep before. There is one problem with using that book as a reference, rootkit.com being you know, trashed by Lulzsec. So the links to example code and utilities no longer exist.

I thought it wouldn't be all that important and I could simply connect my kernel debugger, start a game and watch the driver being loaded (by setting "bp PnkBstrK!DriverEntry" in WinDbg). Boy was I wrong, I don't know if they're doing something special to hide themselves but I couldn't for the life of me break on the driver being loaded. At first I thought I was doing something wrong, so I set the debugger to break on any module load. This can be done by breaking in the current session and going to Debug -> Event Filters and enabling the on module load option.
How to break on module loads (provided they aren't f'ing with you)
So I did this, then hit '.reboot' and watched every driver load. You can get the driver name by using the '.lastevent' command on break.
Using .lastevent on driver load
So, I watched, every, stupid, friggen, driver load (there's a lot by the way). But I never saw PnkBstrK.sys load. What was really strange was I started up a game, then quit out then used Ctrl+Break to cause WinDbg to send a break. I then ran "lm" to see what modules were loaded. I started to see PnkBstrK under the Unloaded section. But.. I could never actually *catch* it loading.
Game loading the drivers, and showing pnkbstrk being 'unloaded'

So how the hell do I break into it? Well first off, I wanted to make sure it was actually being loaded and have 100% control over loading and unloading the driver. To do this the Rootkit book suggests using InstDrv.exe, which as far as I can tell doesn't really exist any more. So instead I found a new tool to help in loading and unloading. I found a tool called WinDriver from Jungo which has a helper tool called wdreg.exe which you can use to load/unload drivers.
Using wdreg to load PnkBstrK
By running the command "wdreg.exe -file PnkBstrK install" you can have the PnkBstrK.sys driver loaded and installed. Notice you don't pass the .sys and you are also required to use the full path (I copied it to the WinDriver directory). So I kept loading/unloading and *still* wasn't able to break. So I started searching around for other methods. Some forums suggested using WinDbg's "bu" command. This did not work. Next I visited openrce to see if they had any tips and found this. Which inevitably lead me to searching for and setting a breakpoint on IopLoadDriver. As an added bonus I found a tweet by stupid smart @Ivanlef0u which was the command I needed:
bp nt!IopLoadDriver+0x66a . Yeah that pasted big, but you know what? I don't care, it deserves that font size, because it friggen worked.
call'ing into PnkBstrK.sys FINALLY!
Now I can start to figure out their dinky little xor obfuscation and see what ioctrl's it uses with the various services... Yay!


Friday, March 23, 2012

Asmjit Based Loader

The reason I'm using asmjit is because it's much better than writing inline assembly. When I used to write memory corruption exploits and shellcode, I used to have to write __asm {} blocks, compile it, look at the generated asm in a debugger/hex editor, copy the bytes, create a char buffer with the data in hex and finally do stupidly crazy unreadable indirection to call it. Like ((void (*)(void)) &shellcode)(); I still don't understand that shit. Overall, it was a very delicate and irritating process.

With asmjit I don't have to do any of that crap. Asmjit is great because it totally abstracts out how you create your instructions, gives you type safety and allows you to serialize the code into data (which I demonstrate in this post). It also contains functions on relocating addresses for when you inject into a remote process.

Asmjit exposes two objects, a compiler and an assembler. I'm not entirely sure about all of the differences, but from what I can tell the compiler seems to be an abstraction on top of the assembler. I believe it is for writing 'higher level' assembly, but in my case I want to write to registers directly because I know exactly what I want.

So what do I want? In this case I want to write a loader that can take in arbitrary dll names and function names. When I used to write shellcode I wasn't afforded one very important luxury. I was exploiting a *remote* process and had *no* idea where any addresses were. To call any win32 functions you need two things. The base address of kernel32, and a method to find the addresses of symbol names. Basically you needed to hand code your own GetProcAddress. If you're curious of an implementation, check out this oldie but goodie at http://www.harmonysecurity.com/files/kungfoo.asm. I'm pretty sure I copied/used that shellcode at somepoint in my past :).   When I first started writing the loader for this post, I was actually rewriting that block of asm in asmjit! Then I thought to myself, what the hell am I doing? I already *know* the addresses of GetProcAddress/LoadLibrary! It's the same for all local processes.

So now I'm doing local injection which gives me, well two things. First, I can easily get the base address of kernel32 using GetModuleHandle. And second, I can get the addresses of GetProcAddress and  LoadLibrary by using none other than GetProcAddress. Then, with the awesomeness of asmjit I can insert these addresses as immediate values directly into my Assembler. I can also write my data (such as the dll path and export name) directly into this Assembler by using the data() method and specifying the buffers and their size. I use a trick which is common in shellcode to jmp down to your data then call back up to your code. By doing this, the call instruction will take the next instruction and store it on the stack for you. You can then either pop it off, or use it directly in your calls. The rest of my code basically just goes through setting up the function calls and grabbing the addresses of the buffers, pretty simple really.
Injecting a DLL and calling an exported function using asmjit


Things of course will need to be changed once I move this code into SoNew as we will be injecting into a remote process.. But without further ado, here's my test loader code, enjoy!


// AsmJitTest.cpp : Defines the entry point for the console application.
//
#include "stdafx.h"
// AsmJit - Complete JIT Assembler for C++ Language.
#include <stdio.h>
#include <stdlib.h>
#include <string.h>

#include <asmjit/asmjit.h>
#include <asmjit/memorymanager.h>

// This is type of function we will generate
typedef int (*MyFn)();

int main(int argc, char* argv[])
{
 using namespace AsmJit;
 const char *dll = "C:\\Research\\SoNew\\Debug\\SoNewTestDll.dll";
 const char *exported_function = "RunTest";

 HMODULE kernel = GetModuleHandle(L"kernel32"); // need kernel32's base address
 FARPROC load_library = GetProcAddress(kernel, "LoadLibraryA"); // need ll
 FARPROC get_proc_address = GetProcAddress(kernel, "GetProcAddress"); // heh :>.
 if (load_library == NULL) {
  printf("load_library is null: %d",GetLastError());
  return -1;
 }
 if (get_proc_address == NULL) {
  printf("get_proc_address is null: %d",GetLastError());
  return -1;
 }
 
 // ==========================================================================
 // Create Assembler.
 Assembler a;
 FileLogger logger(stderr);
 a.setLogger(&logger);
 {
  Label L_lib = a.newLabel();
  Label L_start = a.newLabel();
  Label L_funcname = a.newLabel();
  Label L_callfunc = a.newLabel();
  Label L_exit = a.newLabel();
  
  // Prolog.
  a.push(ebp);
  a.mov(ebp, esp);
  a.jmp(L_lib);      // jmp down to where our lib/dll is.
  a.bind(L_start);     // oh hai again!
  // Start.
  // just to show eax contains addr (next two calls not needed)
  //a.pop(eax);      // address of our dll.
  //a.push(eax);      // push on to stack for ll call
  a.call((sysint_t)load_library);  // load our dll
  a.cmp(eax, 0);      // module should be stored in eax.
  a.je(L_exit);      // make sure we have a valid module handle
  a.mov(edx, eax);     // store module in edx
  a.jmp(L_funcname);     // get the exported_func's address
  a.bind(L_callfunc);
  // just to show eax contains addr (next two calls not needed)
  //a.pop(eax);      // the name of our exported func
  //a.push(eax);      // push name of our exported func
  a.push(edx);      // push addr of our dll
  a.call((sysint_t)get_proc_address); // get exported_func's addr.
  a.cmp(eax, 0);      // func should be stored in eax.
  a.je(L_exit);      // if not bomb out
  a.call(eax);      // and call it!  
  // Epilog.
  a.bind(L_exit);
  a.mov(esp, ebp);
  a.pop(ebp);
  a.ret();
  // our "data" section
  a.bind(L_lib);
  a.call(L_start);
  // write our dll path as data.
  a.data(dll, strlen(dll)+1);
  a.bind(L_funcname);
  a.call(L_callfunc);
  // write our exported function name as data
  a.data(exported_function, strlen(exported_function)+1);
 }
 // This is entirely to demonstrate how we can treat the 
 // code as data. If we are going to inject into a remote
 // process we will need to relocate it differently.
 // But for local processes it gets the point across!
 size_t code_size = a.getCodeSize();
 MemoryManager *mm = MemoryManager::getGlobal();
 void *p = mm->alloc(code_size, MEMORY_ALLOC_FREEABLE);
 if (p == NULL) {
  printf("Error allocation of our code buffer returned null!");
  return -1;
 }
 void *data = a.make();
 memcpy(p, data, code_size); 
 a.relocCode(p);
 printf("Code size: %d\nNow Calling...", code_size);
 ((void (*)(void)) p)();
 MemoryManager::getGlobal()->free(p);
 // Or screw all that above noise and just cast and call.
 // MyFn fn = function_cast<myfn>(a.make());
 // fn();
 // MemoryManager::getGlobal()->free((void*)fn);

 return 0;
}